
This post is based on a real email conversation, but the numbers here have been changed. We believe this is an important conversation, and that the entire non-profit sector — as well as funders — might benefit from considering factors like the ones discussed below. Enjoy!
NITHYA is Nexleaf’s CEO. ERIN is our Data Communications Lead, and JESSE is our Data Scientist.
NITHYA: Hi Erin and Jesse, A draft Erin recently shared said, “We observed a clean cookstove adoption rate of 91.1%.” Including a decimal of .1 implies a certain degree of precision, and it can actually indicate a level of precision that our inputs don’t allow for. This is especially relevant to vaccine refrigerator uptime, as well as the rate of improved cookstove adoption. Can you both share your thoughts?
ERIN: Any household that cooks more than 1 hour a day on average on the improved cookstove is considered to be adopting. So in that sense, adoption on an individual household basis is a simple yes or no. The group of cookstove users in question consists of 45 households. Since 41 out of 45 households are adopting the improved cookstove, and 41/45 is .91, I wrote that the adoption rate was 91.1%. Is that incorrect?
JESSE: As a data scientist, I sometimes struggle to strike a balance between stating our results with pure scientific rigor and communicating our impact in a way that’s easy to understand. The way we measure adoption, we’d need to be looking at ≥317 households in this cohort to be able to justify the decimal place in saying 91.1% for adoption.
ERIN: I’m not sure I understand. Why 317?
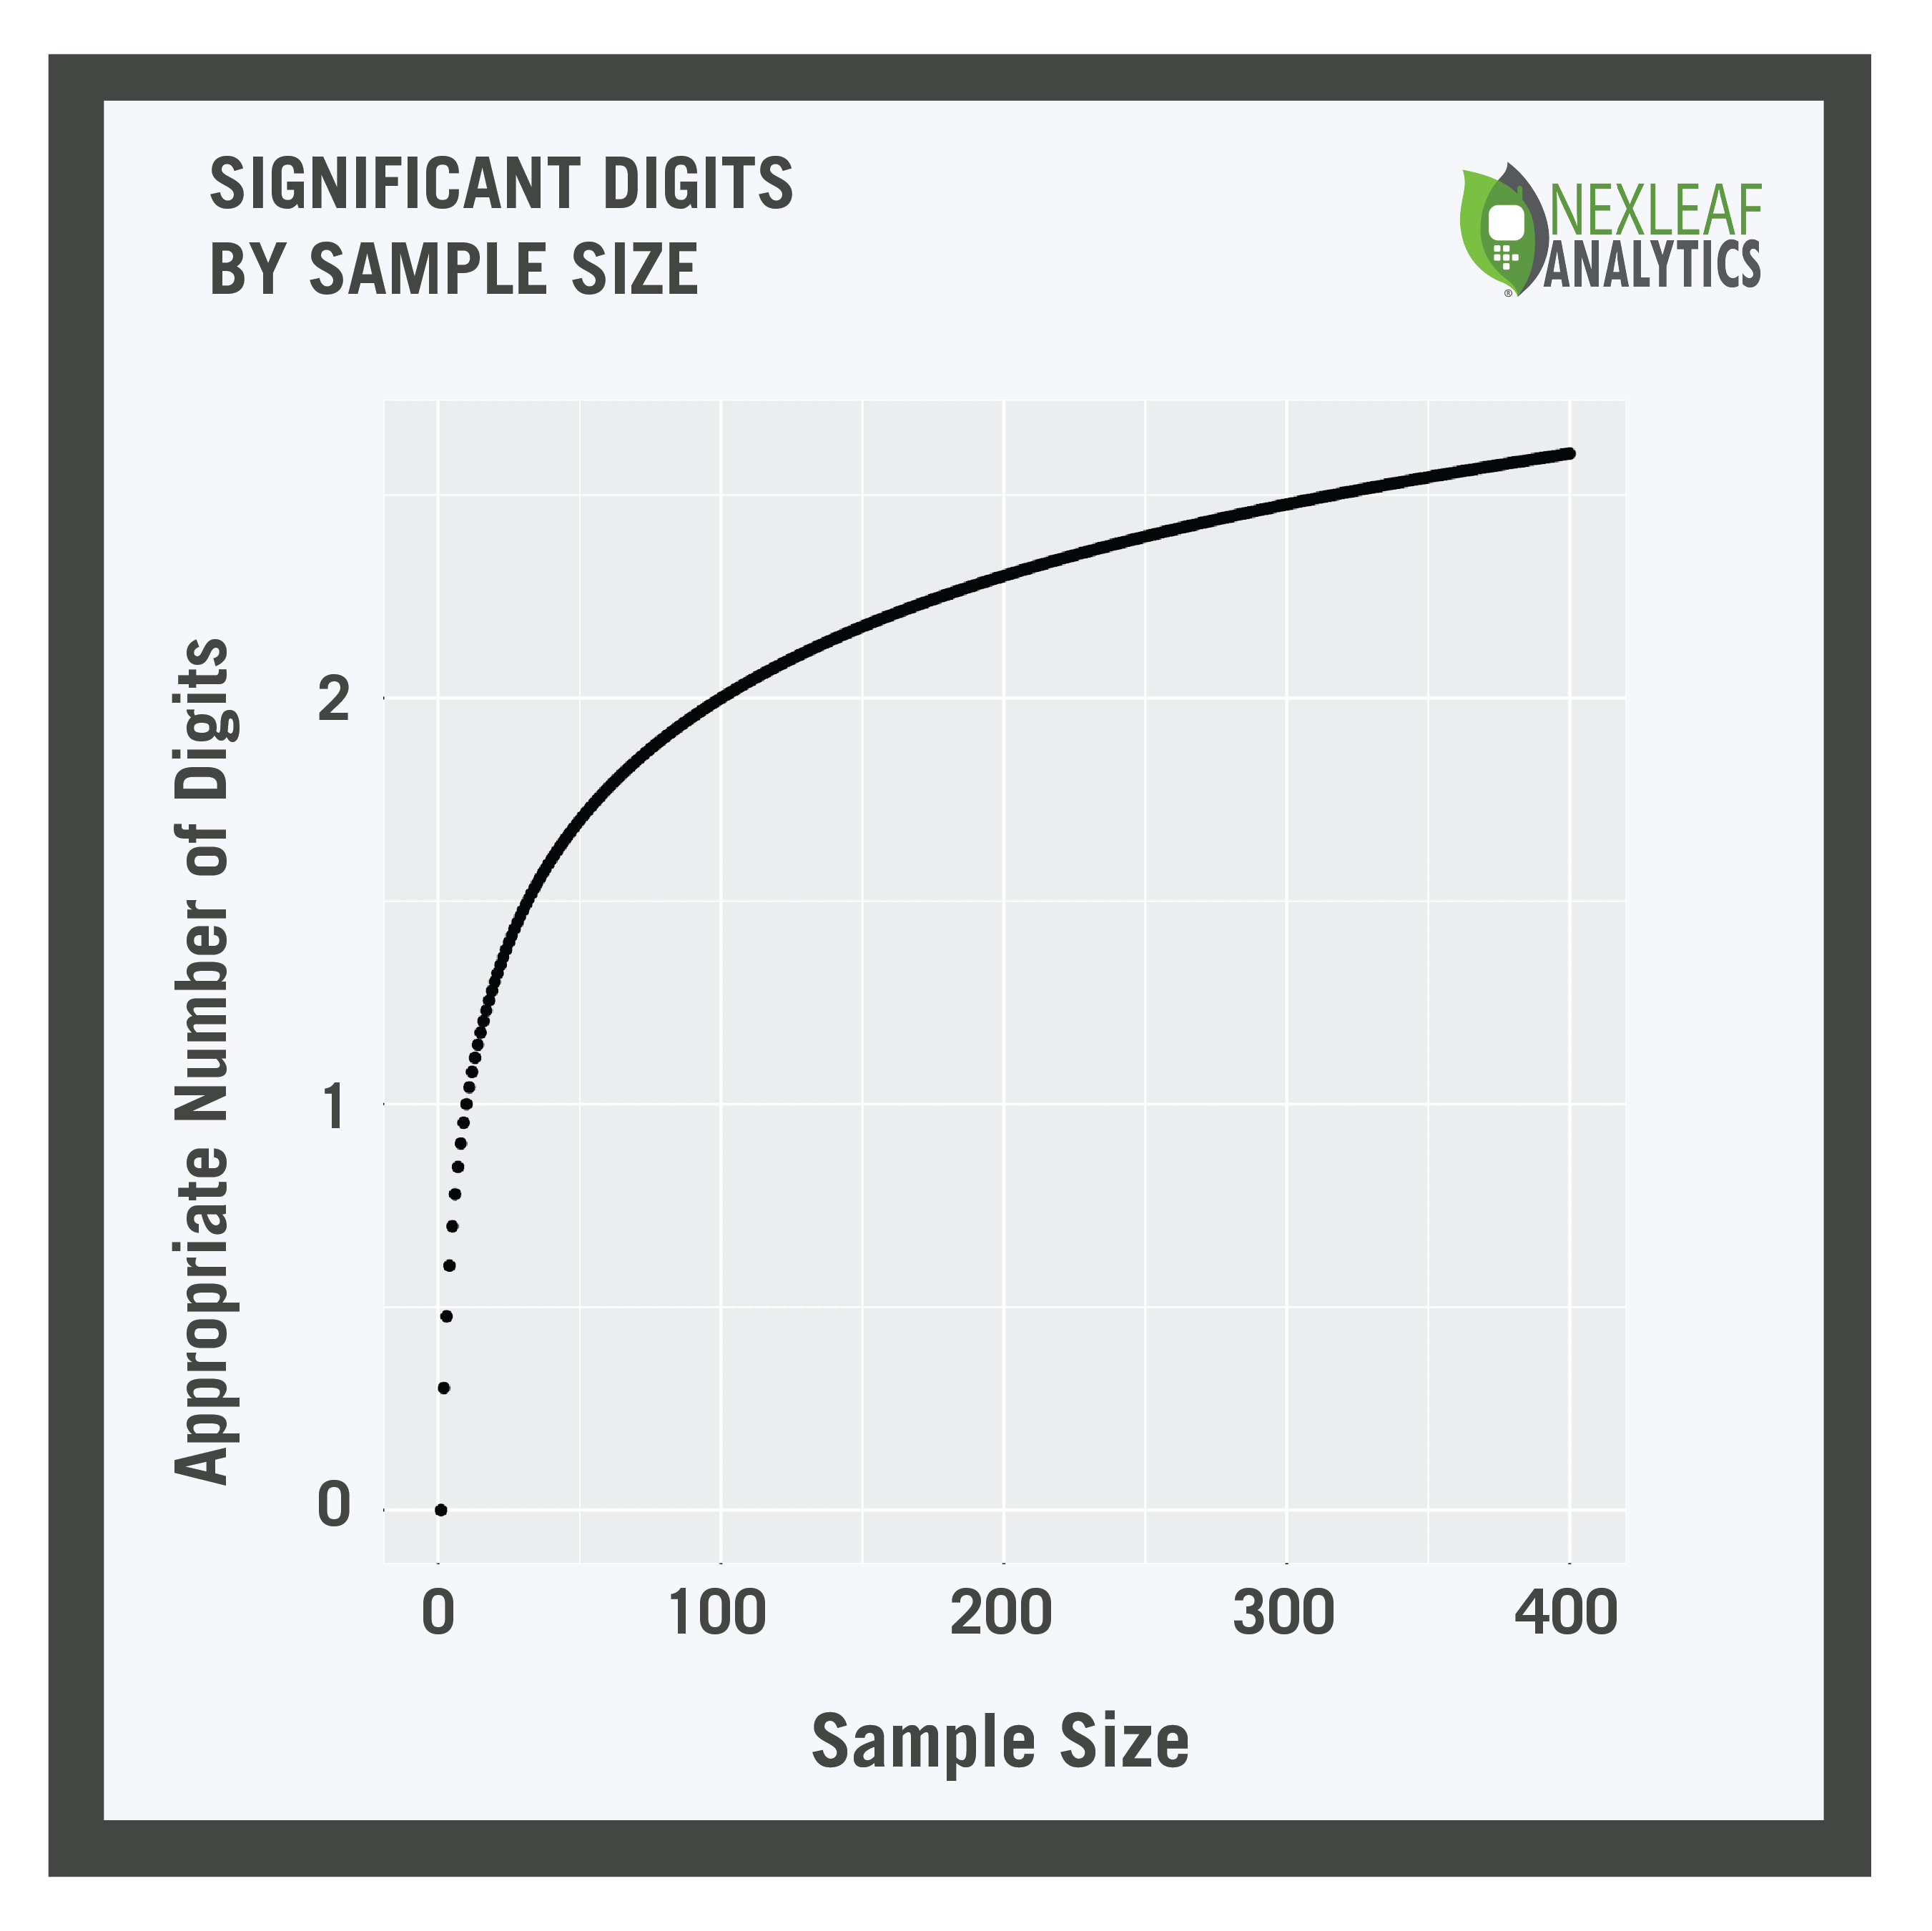
JESSE: People with scientific backgrounds could read the number of decimal places as an implicit statement about sample size. Therefore, the number of digits you use shouldn’t be more than the precision offered by that sample size. We can calculate this by taking the logarithm of the sample size. That would look like the graph to the right.
People with scientific backgrounds could read the number of decimal places as an implicit statement about sample size.
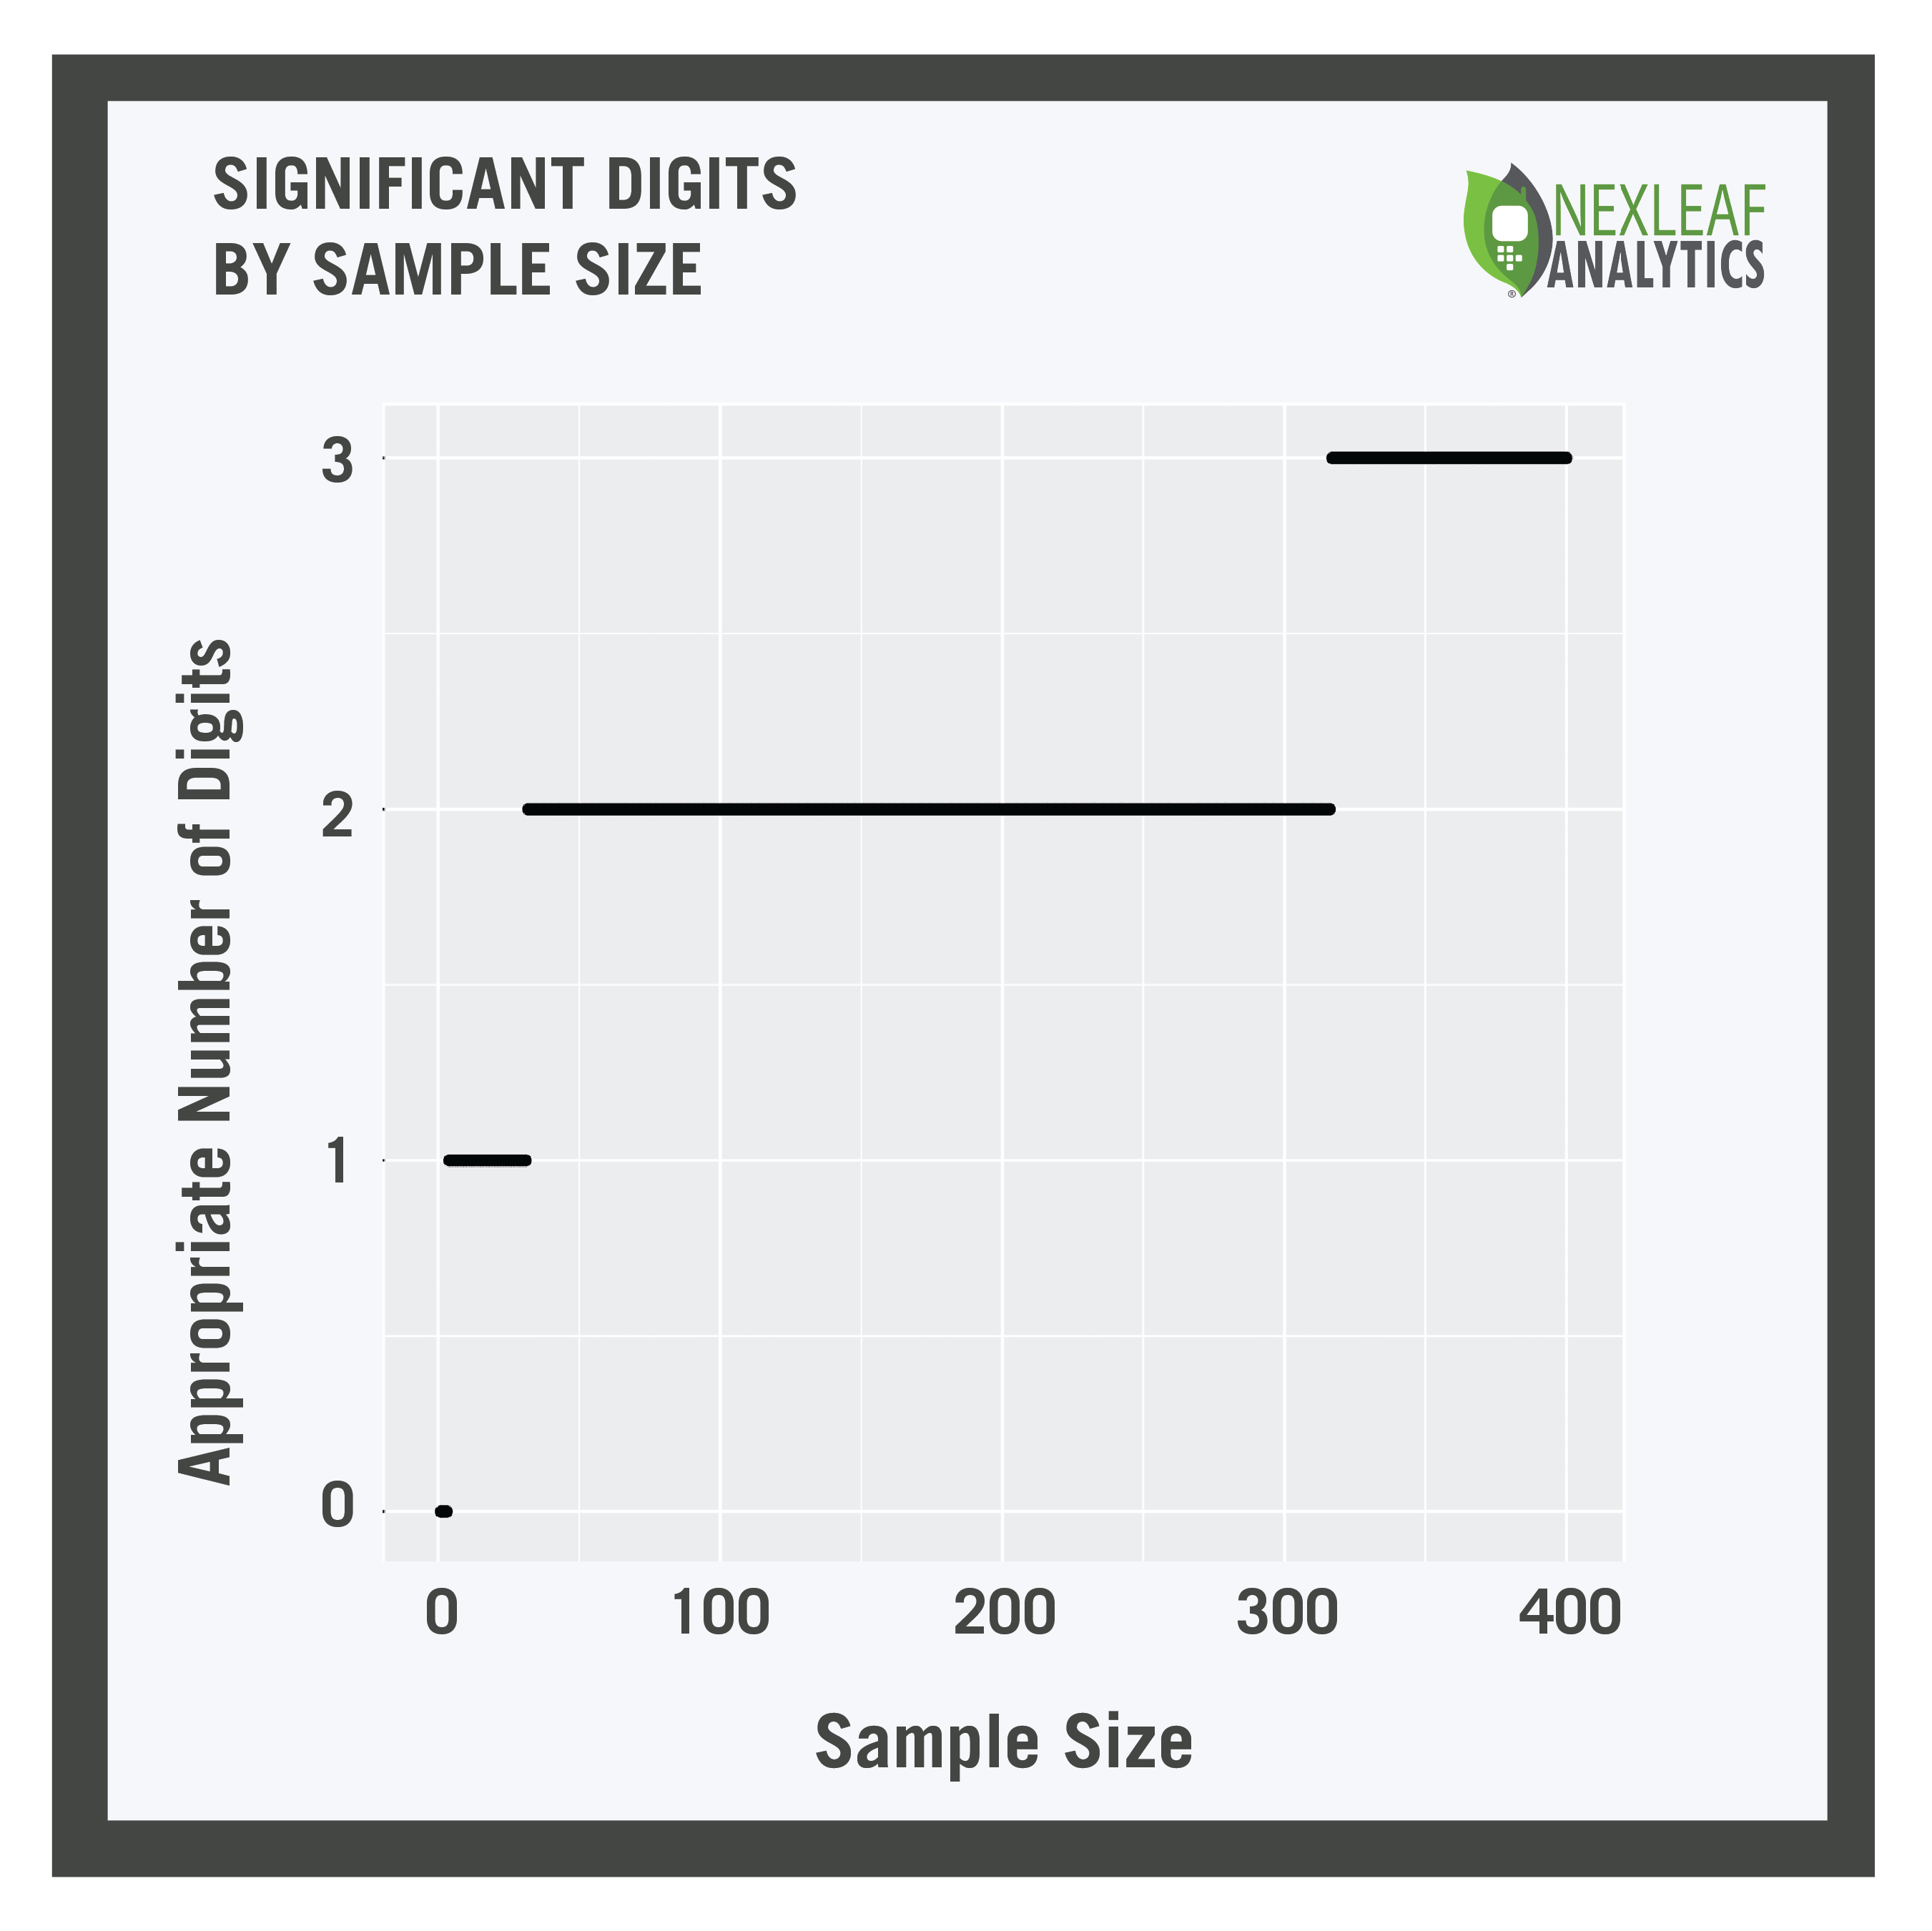
But of course you can’t have a fractional number of digits, so we round it, as seen in the graph to the left.
So looking at this, we see that if your sample size is three or less, you can’t even really report one significant digit. In this case it may be wise to think about whether you should be reporting results at all! If we have a sample size from 4 to 31, one significant digit is appropriate. Sample size from 32 to 316 gets us two significant digits – and once you get to a sample size of 317 then you’ve justified the decimal!
ERIN: That is really cool. So with a sample size of 45, we can only report two significant digits?
JESSE: Yup! And how we report stats like this has other implications as well, having to do with the nature of our inputs and how we choose to interpret them behind the scenes.
For example, consider a household where we have cooking data for 50 out of 60 days. Ten days of data are missing. The user cooks on her improved cookstove for 1.05 hours on each of those 50 days for which we have data. Because we assume that cooking behavior is the same on the days where we’re missing data, we would say that her average cooking is 1.05 hours per day, so she is adopting her improved cookstove.
But this is assuming that the user’s behavior on the “no data” days is just like her behavior on the other days. What if it she actually cooked 0 hours per day on those 10 days? Then her average improved cookstove cooking goes down to 0.875 hours per day, so she’s not adopting.
Factors like our assumptions around missing data — which is, of course, different from actual data that states zero cooking has occurred — also impact the precision that we can use when we state our results.
To address this, we could do a calculation to indicate the margin of error in the data we’re presenting. All we’d have to do is bootstrap the cooking time on the days for which we have data, creating a probability distribution for the amount of cooking we might expect to see on a given day. Then we could use this distribution to repeatedly fill in the missing days at random, thereby enabling us to assign a confidence interval to our adoption number! It’s a beautiful approach in its simplicity!
ERIN: I appreciate your enthusiasm! However, from a communications perspective, I don’t love that idea. It’s not standard for how non-profits share impact numbers. I worry that including a margin of error would confuse readers when we’re presenting our impact rather than, say, discussing our findings in a scientific paper.
JESSE: I know; the last thing we want to do is to confuse people.
I think that, in this case, we can simply share how we deal with missing data. The only change necessary is to present the improved cookstove adoption rate for this group so that there are only two significant digits.
ERIN: So I’ll change the adoption rate number from 91.1% to 91%?
JESSE: Yes, just drop the decimal. I think that’s the right call here!